
Do you need SPSS discussion help similar to the one below? Click the button below and send us your requirements.
Visual displays of data provide you and anyone else with a graphical display of what is often a complex array of quantitative data. A key strength of visualization is the ability to quickly enlighten you with key data. Rather than solely relying on your audience to interpret numerical values and statistics explained in a narrative, a visual display can easily illustrate descriptions, relationships, and trends. Although the focus is on simplicity, the researcher has an obligation to present these graphical displays in a clear and meaningful way.
For this Discussion, you will explore ways to appropriately display data.
How to Prepare for this Discussion
- Review the Learning Resources for this week related to frequency distributions and graphic displays of data.
- Using the SPSS software, open the General Social Survey dataset found in this week’s Learning Resources.
- Next, create a figure or table from a few selected variables within the dataset.
- Finally, think about what is good about how the data are displayed in the figure or table you created and what is not so good.
According to APA style, a table has a row–column structure; everything else is called a figure (chart, map, graph, photograph, or drawing). This post won’t discuss the creation of a figure—the possibilities are endless—except to say that figures are not enclosed in a box (as they are in the APA Publication Manual). If you’ve not created a table before, it may take a little practice.
Keyboard Steps to Create a Table
In the Word toolbar, go to Table > Insert > Table > Table size. Pick the number of columns and rows you think you’ll need. Make sure to add one each for the headers of the table and the stub column (which lists the individual items).
Under AutoFit behavior, try AutoFit to Contents. That way, your table will automatically expand to fit whatever data you put in the various cells. You can always change it later.
Under Table Style, try Table Normal. It’s standard, it’s simple, it’s clean.
We have SPSS data analysts ready to start working on you assignment. Click the button below to order with us.
Formatting Tables and Figures (and the three forms of notes used at the end of a table). Note how tables and figures are formatted in opposite ways.

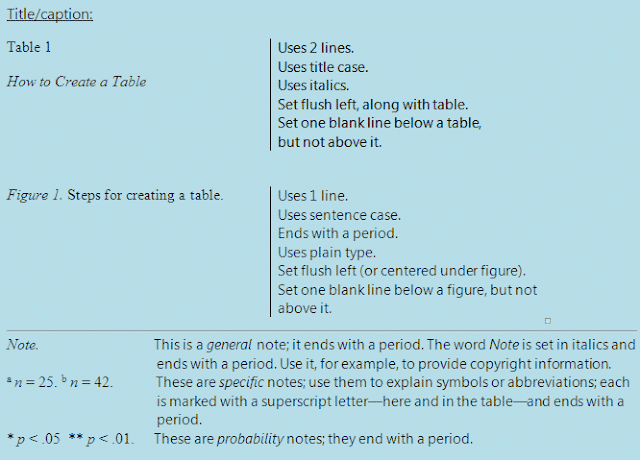
APA and University Requirements
- All cells in a table, and callouts in a figure, use sentence case.
- APA style does not use boldface type or vertical lines in tables.
- Do not put a box around a figure.
- Make titles and captions concise, clear, and expressive. (APA 5.12 & 5.23)
- Do not split a table unless it is too large to fit on one entire page. It works best to start tables at the top of a page; that way, there will generally be enough space. It’s OK if the table appears on the page following its first mention.
- If a table is, indeed, too large for one page, then type (table continues) under the table, flush right. Repeat the column headings (not the table title) at the top of the new page.
- If a table or figure takes up 75% or more of a page, then set no text on that page.
- If needed, use a different point size (or font) for the text of the table or figure, but in any event, do not use smaller than 8-point type.
- For numerous examples of tables, see APA Publication Manual, pp. 129–150; for numerous examples of figures, see pp. 152–166. I would encourage studying them all closely. You can also see several examples on the Writing Center website.
Do you need accounting assignment help on project evaluation similar to the question below? Please click the button below to share the details.