Decision-making is a crucial part of business growth, and making such decisions; sometimes, it may require assessing the relationship between two or more variables. A good sales manager might check the relationship between advertising expenditures and sales. This helps to determine whether the expenditures might be used to predict sales based on the amount spent on advertisement. A Biostatistician might be interested in determining the relationship between the intensity of the stimulus and reaction time.
In such cases, regression analysis comes in handy. Regression analysis is crucial in assessing specific forms of relationships between one or more variables. It helps in predicting or estimating the values of one variable using either one or more variables.
Regression Models
One uses a mathematical model into which sample data is fitted. In the regression model, the predicted variable is called the dependent variable. The values used to make predictions are independent variables, regressors or predictor variables. The simplest form of the regression model involves one dependent variable and one independent variable. When two or more independent variables are involved, the model is regarded as multiple regression. The simple regression model mathematical expression is;
, where
and
are the model parameters, and
the error term. The error term is the unexplained variation in a linear relationship between y and x.
Do You Need Regression Analysis Help for Your Homework?
At TopPaperArchives, We have the best Statisticians for Students who need college statistics help. Our support team is always ready to listen to your needs and advise you on the best way to handle the assignment. Click on the chat button below to improve you statistics grade.
Expected Value of the Regression Equation
The equation indicating the expected value of y, E(y) and how it relates to x is regarded as a regression equation
. The equation points one important property or assumption of the regression model;
. That is, the expected value of the error term is equal to zero. The error terms are assumed to have a normal distribution (
). When choosing linear regression, one must check whether the data can be used in the regression model.
Assumptions of Regression Models
- Both responses; dependent and independent variables are on a continuous scale. When a model is fitted to predict sales using advertisement expenditure, both variables are on a continuous scale.
- Linearity: there is linear relationship between the response variable and the independent variable. The linearity assumption is usually assessed using a scatterplot. The trend in the plot is assessed if it exhibits some linear or curvilinear trend. In the case of a curvilinear trend, higher-order equations such as quadratic or cubic are fitted. If linear regression is fitted to data with a curvature trend, the estimates obtained are not efficient.
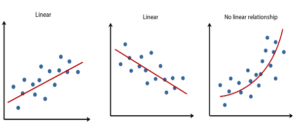
The first and second plot illustrates a linear relationship between the dependent variable. The third plot indicates a curvature trend, which indicates that linear regression is not ideal in such a scenario. In addition, the scatter plot should not have an outlier. That is, the data should not have extreme outliers since they significantly influence or affect the relationship between variables.
- Independence: The observation of one value should not influence or affect the observation of another value. Therefore, the data should not exhibit any form of serial correlation between the observations.
- Normality: as earlier mentioned, the residuals should be normally distributed
- Homoscedasticity: the residuals have a constant variance. This assumption is tested using a scatter plot in residual assessment. The distribution of the error terms is plotted and an assessment is made to determine whether the residuals funnel out. The plot below illustrates some of the expected plots.
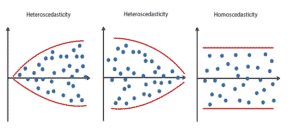
For the first two plots, the residuals funnel out, which shows that the model suffers heteroscedasticity or the variance of the residuals is not constant. In the third plot, the residuals are evenly distributed, which suggested that they have constant variance.
The Least Squares Method
The least-square approach is usually used to fit the regression model. The aim of this approach is to minimize the sum of square residuals. The estimates of the model parameters are computed using the formula below:
Regression Analysis Using Excel
Excel can be used to fit the regression model using the data analysis tool pack. The following data are used to fit a regression model in Excel.
| X | Y |
|---|---|
| 1 | 2 |
| 2 | 8 |
| 3 | 5 |
| 4 | 11 |
| 5 | 14 |
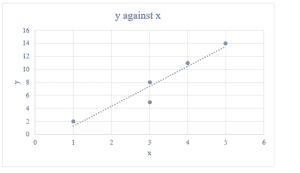
The trend line shows a linear relationship between x and y. Therefore, the linearity assumption is met. The simple linear regression is fitted using the data analysis tool pack. The steps involved are;
- Step 1: Data > Data analysis > Regression
- Step 2: Input the range of Y and X.
- Step 3: Click, OK.
The following is a summary of the model.
The results show that the regression model is: y = -1.81818 + 3.068182x. The model shows that when there is a unit increase in x, the variable y is expected to increase by 3.068182 units. This regression equation can be used to make predictions. For instance, when x = 4, y = -1.81818+ 3.068182(4) = 10.454548.
You must be logged in to post a comment.